tags:
  - mathematics
  - engineering-statistics
  - school
  - bsu
  - spring-2025
  - math-360
  - formulation
  - homework
source: https://www.webassign.net/web/Student/Assignment-Responses/last?dep=36404407
created: 2025-02-12
(a)
Probabilities:
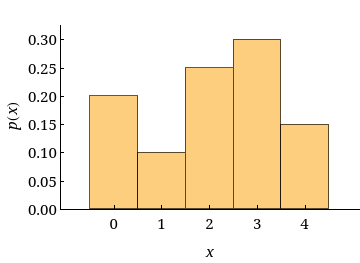
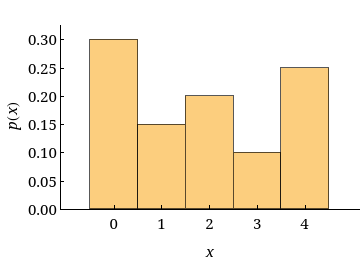
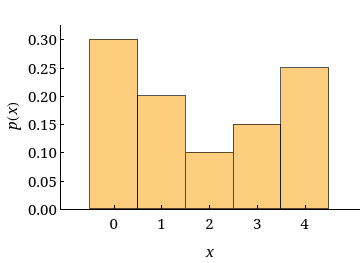
Problem: Pick the corresponding probability histogram.


Process: The x-axis represents the possible inputs of the probability mass function. The y-axis represents the output of the probability mass function given an input from the x-axis. Every vertical bar in an accurate histogram will have its top edge at the y-value corresponding to the value the probability mass function would give if the x-value below the vertical bar was passed to it.
Answer:

(b)
Problem: What is the probability that at least two students show up? More than two students show up?
Process: The probability that at least two students show up is equal to
(c)
Problem: What is the probability that between one and three students, inclusive, show up?
Process: ...